Analyse the performance of your app subscriptions
19 Dec 2019 - Ricardo PereiraIf you have an app that includes in-app subscriptions, then hopefully one day you’ll want to analyse the performance of each subscription or even the conversion rate from an introductory offer to a standard price.
Let’s imagine you have an app with a monthly subscription and that subscription has a free trial of 2 weeks as an introductory offer. Now you are looking for clean data in new trial initiation and members who continue to being a paying member from their free trial. With this in mind, let’s assume you want to track the following:
- Number of new free trials
- Number of conversions to standard price (the trial ends and the user didn’t cancelled the subscription)
- Total of paying users (number of active subscriptions without free trials)
- Total of users who cancelled within the free trial period
For this, you don’t need an external service, we can gain insights by using the App Store Connect and it doesn’t require any technical implementation. The Sales and Trends section offers you a couple of options, categories and filters to understand the subscription activity. Let’s have a look.
Number of new free trials
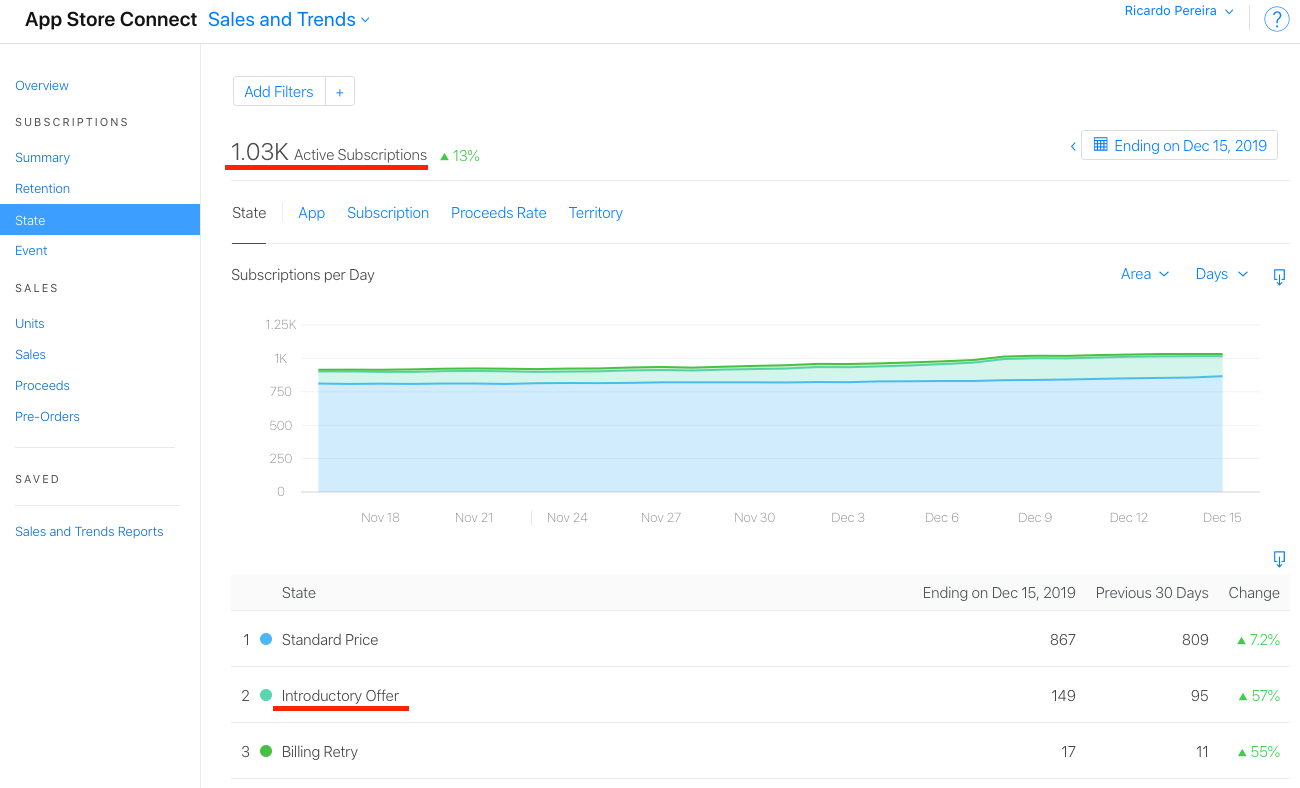
I usually start by looking at the current state. Selecting the Sales and Trends > State overview will show you the total of active subscriptions, including the total of free trials (represented by the Introductory Offer).
But this doesn’t answer your initial goal. You want to know how many new free trials happened between two dates. Select the Event option and in there you can see the data by event like activations, cancelations, reactivations, etc. You can also filter data by selected date ranges, which is nice.
Go to Subscription Events to check the explanation of each event.
Now, select the Activations event type. The Activations event type will gather all type of subscription activation like an introductory price begins or a subscription begins without an introductory offer, and that’s why we need to filter the data to just include the activation data with an introductory offer: hit Add Filter > Current State and select Introductory Offer.
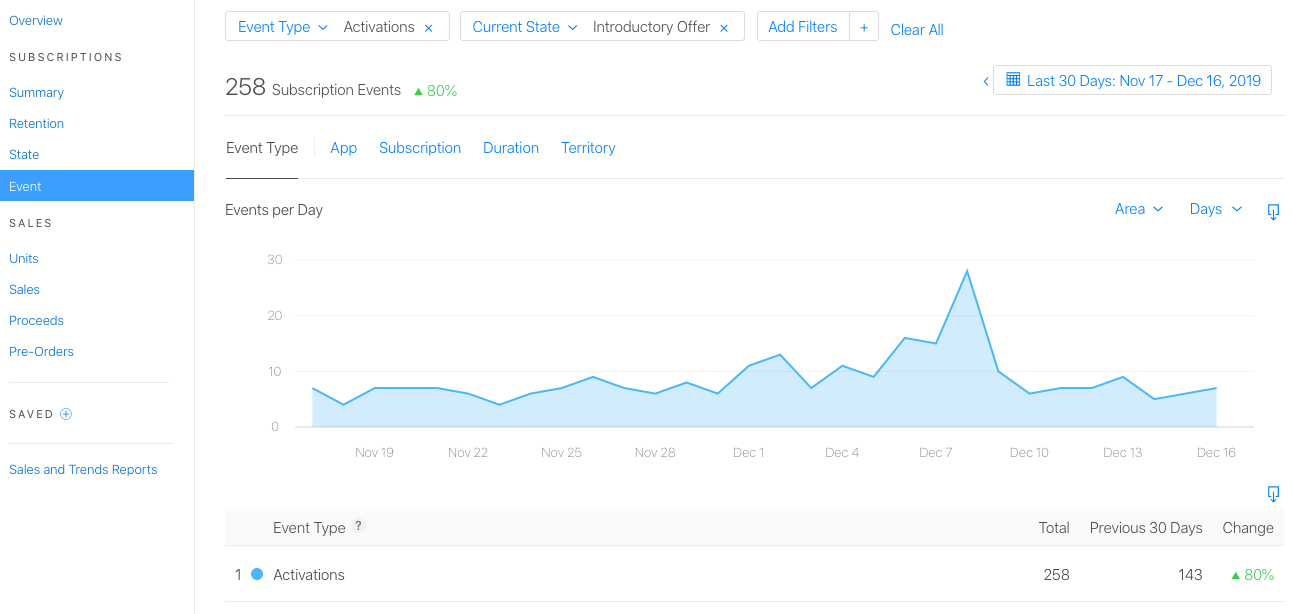
This will show you the number of new free trials.
Number of conversions to standard price
I like this one since it’s easy and you don’t need to filter anything. It’s already available by default and the event is called: Conversions to Standard Price.
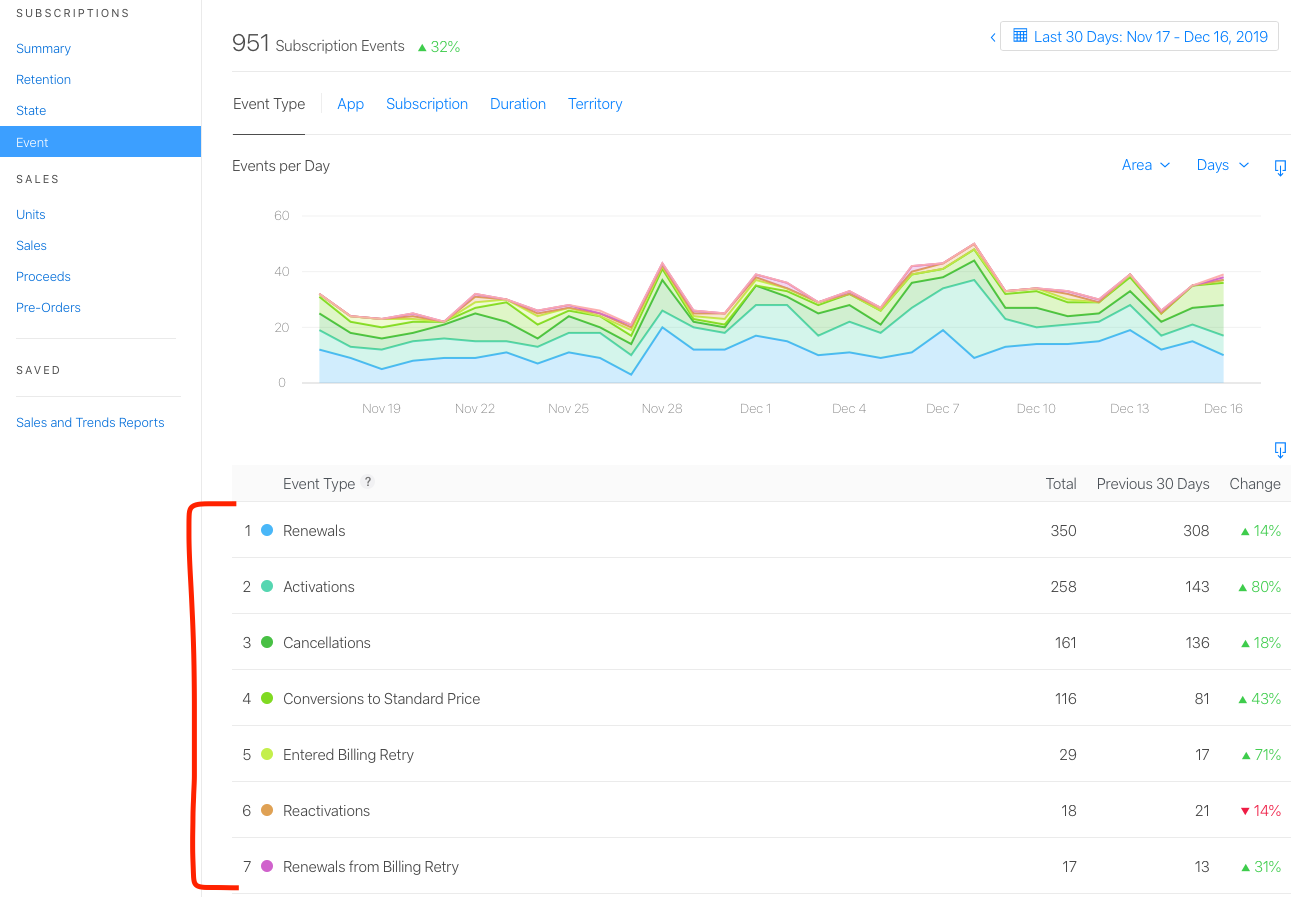
The member switched from an introductory offer to a standard price subscription 🙌
Total of paying users
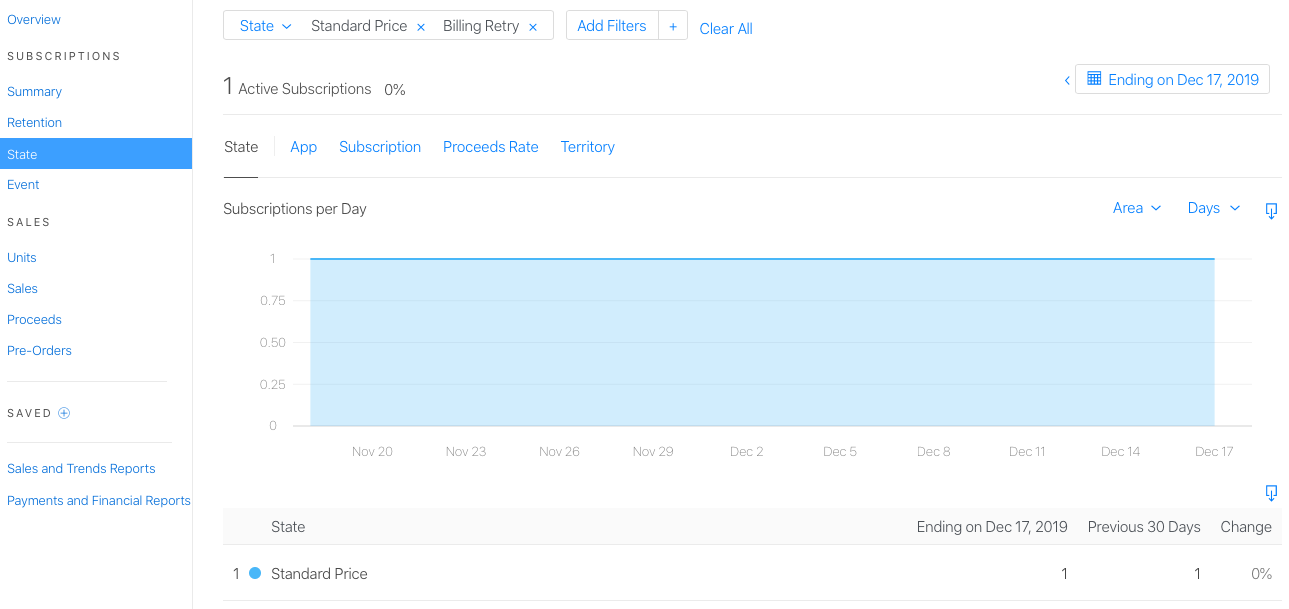
Just go to the State overview and filter by state: Standard Price & Billing Retry. This will give you the total of subscribers that are really paying for the subscription, excluding the introductory offers, promotional offers, etc.
Total of users who cancelled within the free trial period
Last but not least, since this is relevant information to understand if members enjoyed the trial or not. Select event type Cancellations and filter by Previous State. The Previous State should be Introductory Offer.
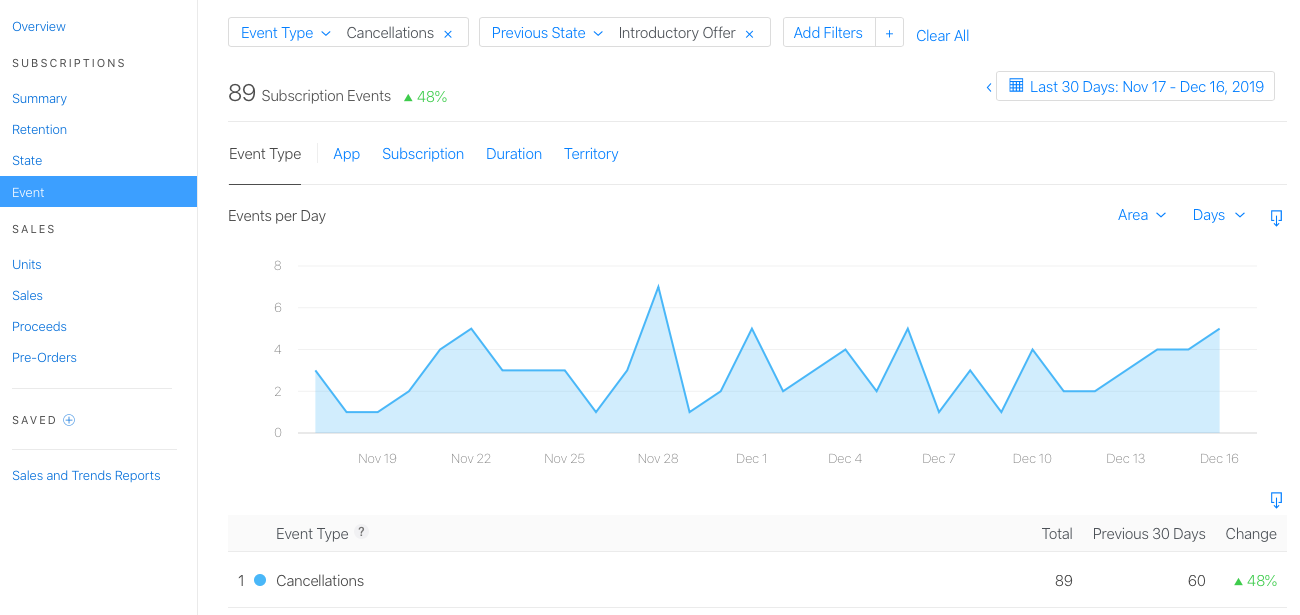
If you have 200 new free trials and after the trial you have 100 members that cancelled the subscription, then you lost half of your leads. If that’s the case, then it’s time to reflect what’s going on. For example, try to see the percentage breakdown of reasons for a cancelled subscription for a selected end date, including billing issues and price increases.
Conclusion
It’s always important to keep some anonymous data about your app where you can understand if the app and its features are doing a good job. There are many services where you can send and analyse the data like Mixpanel, Amplitude, Google Analytics, but good metrics are hard to achieve and sometimes Apple does part of the job for us and tracking metrics about subscriptions is one of them.
Extra: Subscription Offers Best Practices - WWDC 2019 - Videos - Apple Developer
If you are interested in more about the Apple ecosystem, then follow me on Mastodon.
Ricardo Pereira